Glassbox Self Help
Help Table Of Contents

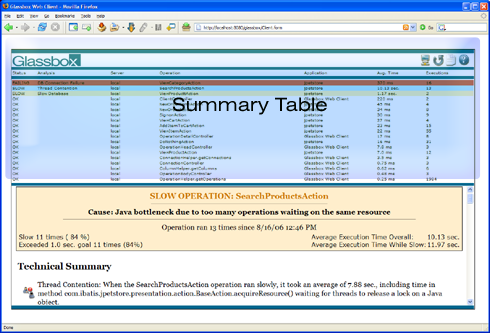
Operation Summary Table To enlarge, click image.
Status
The status column tells at a glance whether the operation is performing normally (OK), exceeding the performance goal (SLOW), or encountering an error (FAILING).
Analysis
For any operation that is slow or failing, you can look in the analysis column for a quick summary of the cause of the problem.
Server
This column displays the name of the agent connection that was configured using the connection panel. In a clustered environment, it allows you to distinguish operations on different servers.
Operation
Glassbox uses internal heuristics and a knowledge of common application frameworks to determine an appropriate name for each operation.
Application
Displays the name of the application, assuming that it is defined either by the deployment descriptor or by the name of the directory where it was deployed. This is particularly useful when someone is running multiple applications of the same framework, for instance several different Ajax based applications.
Average Time
This columns shows the average time taken by that particular operation. This helps someone to assign priority to operations of the same status.
Executions
The executions column indicates how many times this operation has run since the application server was started or Glassbox's statistics were last reset.
Table of Contents

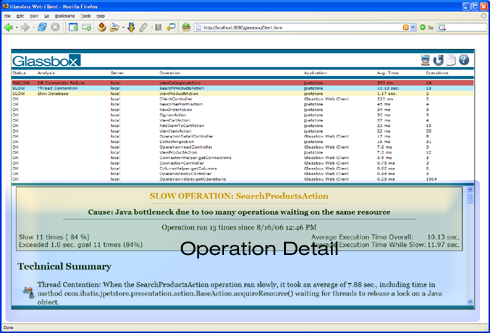
Operation Detail Panel To enlarge, click image.
The Operation Details Area
The details area provides information relating to operations selected in the summary table. It starts with an Executive Summary, outlining the problem's severity, type and location, then continues through a Technical Summary to the Technical Details providing relevant database, remote service and code level details that allow DBAs and developers to locate and fix issues.
Hint: Control-click on a line in the summary table to open the details in a new window.
Executive Summary
The executive summary is contained in the first table that lives at the top of the detail pane. A high level view of the problem, intended to give someone a quick view of what general area of code is affected, and how severe the problem is.
Technical Summary
The technical summary provides management level details that include additional specifics in paragraph form, including such things as what query or method was slow, what database is affected etc. This is intended to give a 15-second summary of what the problem is, and to be suitable to cut-and-paste into summary reports for management.
Technical Details
Technical details provide an engineer enough information to find and fix the problem. This includes stack traces, the names of thread locks, SQL tables and other forms of exact and highly technical information. It is suitable for a manager to mail to an engineer, or for QA or IT professionals to use when filing a bug.
Common Solutions
Shows common solutions that people have found to fix problems similar to the one you are experiencing. These are hints and valuable as a rule of thumb, particularly if you are not familiar with fixing a problem of the type diagnosed.
Ruled out potential problems
Lists the other types of problems Glassbox considered and eliminated as possible problems. If troubleshooting a particularly sticky issue, it saves time to know what problems have already been ruled out.
Table of Contents

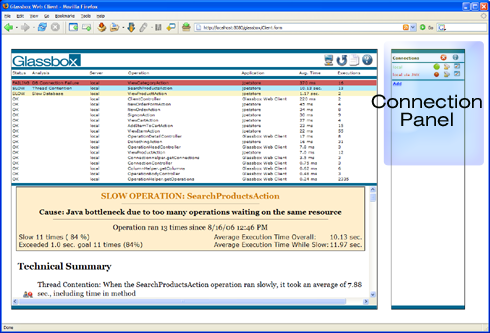
Connection Panel To enlarge, click image.
The connections panel configures which servers the browser-based client can reach, what type of connection is used, and which are being viewed now. It contains the Connection Configuration region, which is described in a different section of this document.
By default, Glassbox comes configured with two connections configured:
- Local: This connection is shown by default (green dot) and tries to show the operations being run on a web application running on this same application server.
- local via JMX: This is a sample connection that is turned off by default (red dot) and tries to use JMX over RMI to connect to your local server. This is primarily a placeholder showing how you would connect to a remote application server, for use in a clustered environment or when you wish to show multiple servers on the same client.
Icon Explanations:
- Status Dot (red, green, yellow) A Green Dot indicates that you have connected to this server and it is currently being viewed. A Yellow Dot indicates that Glassbox is trying to show details about this server, but it was unable to connect to a successfully started server. A Red Dot indicates Glassbox is not currently interacting with this server.
- Reset Statistics This button resets all the statistics for this server, wiping the slate clean. WARNING: This effects all users, and cannot be undone.
- Edit Connection Shows the connection details, allow the information like Host and Port to be edited.
Table of Contents

Connection Panel To enlarge, click image.
The Connection Configuration region lies inside the Connection Panel, and configures the technical details behind each of the server connections
Entry Field Explanations:
- Display Name: A nickname you give this server, pick something short and meaningful. The display name will be used frequently in Glassbox to refer to this server.
- Host: The hostname for this server. 'localhost' is the most common choice, but other examples could be '192.178.1.305' or 'Sampson'
. This hostname must be reachable from the application server machine, no firewall blocking connection for example.
- Port: The port this particular Glassbox server is listening on, by default the port is '7232'
- Protocol: What protocol should Glassbox use to reach the server? If this client's web application is running on the same application server as
the web app to be monitored, then 'Local VM' is the easiest choice. The 'JMX over RMI' and 'RMI' options will reach remote application servers, for
use in a clustered environment or when you wish to display information from multiple application servers in the same client. These options have the
standard limitations around firewalls and naming of RMI directories (see the user documentation
for details), and some base knowledge of networking is useful.
Table of Contents
- Are you having any more releases of the Glassbox Troubleshooter? Glassbox Troubleshooter was merged into the Glassbox 2.0 code line.
- Are you having any more releases of the Glassbox Inspector? Glassbox Inspector was merged into the Glassbox 2.0 code line.
- Are you having any more releases of the SWT based thick client? None are planned, the client was moved to an Ajax browser-based client for Glassbox 2.0 and the response has been very positive..
- Does Glassbox have a consulting practice? Yes, please see our Professional Services page.
- Can a single client connect to multiple servers? Yes, configure multiple servers in the Connection Panel and you can monitor them. Glassbox must have been installed on all those server, of course.
- How much memory does Glassbox Use? It varies based on the application and number of JSPs and it has been going down as we revise Glassbox. Currently an added 5% to a loaded system, with a slightly higher percent on an unloaded system.
- How much time does Glassbox add to the start time for an application server? Again, it waries with the size of the app, but a 25% increase is in the right ballpark, so a 16 second startup might take 20 seconds using Glassbox. On a slow starting server that takes 5 minutes to start normally, Glassbox might add a lower percentage like 10%.
- How much time does Glassbox add to running an operation end to end? Of course it varies again, but between 3-5% is the right ballpark.
- Is Glassbox still FREE if I want to use it in my company? Yes.
- How do I turn off the DWR logging for 'getOperations'? This chatter in the logs is normal for DWR/Ajax applications, but it clutters logs and can even slow performance in extreme cases. To turn it off, edit your server's log configuration files (log4j.xml, log4j.properties, logging.properties) to disable logging for log4j.logger.uk.ltd. Setting log4j.logger.uk.ltd=WARN or log4j.logger.uk.ldg.level=WARNING
- Can I build a product based on Glassbox and sell or distribute it? See the Glassbox licensing page, AND talk to Glassbox before starting such an endeaver.
- Does Glassbox integrate with any monitoring framework, like Nagios or HP OpenView? We have done some base work to allow it, but the work has not been completed or released up to this point.
- How could I contribute? Visit the Glassbox website and click 'Get Involved'.
- Do I need to change my code for Glassbox to work with it? No, drop in the Glassbox web application just like you would any other web app, and visit the 'glassbox' app to walk through installation. In a couple minutes, you can troubleshoot your other webapps with no code changes or even knowledge of the other webapps needed.
- Does Glassbox fix my code, or just find where the problem is? Drop in the Glassbox webapp, install it, and it will troubleshoot for you. It tells you where to fix your code, but it does not attempt to fix it automatically for you.
- I don't see my favorite Application Server on your list, would you consider porting to some others? Yes, and we would like give some added priority if someone was looking to use it, or if someone was able to help us certify a new web application.
- I don't see my favorite Browser on your list, would you consider porting to some others? Yes, and we would like give some added priority if someone was looking to use it, or if someone was able to help us certify a new browser.
Table of Contents